|
|
2017 College Senior
Survey
CIRP Construct Percentage Report
Social Self-Concept
Graduating Seniors |
|
|
|
|
|
|
|
|
|
|
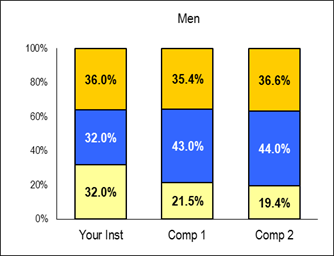
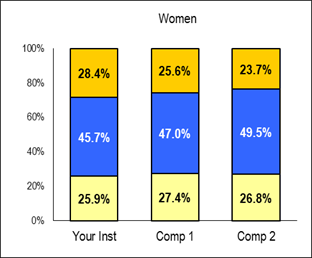
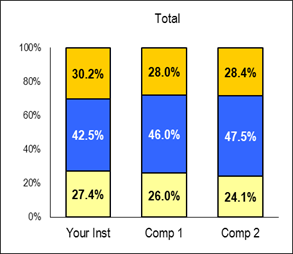
| Social Self-Concept is a unified measure of
studentsí beliefs about their abilities and confidence in social situations. |
|
|
|
|
|
|
|
|
|
|
|
Total |
Men |
Women |
| Montclair
State University |
Your Inst |
Comp 1 |
Comp 2 |
Your Inst |
Comp 1 |
Comp 2 |
Your Inst |
Comp 1 |
Comp 2 |
| Total
(n) |
106 |
654 |
14,474 |
25 |
158 |
5,286 |
81 |
496 |
9,188 |

|
30.2% |
28.0% |
28.4% |
36.0% |
35.4% |
36.6% |
28.4% |
25.6% |
23.7% |

| Average
Social Self-Concept |
|
42.5% |
46.0% |
47.5% |
32.0% |
43.0% |
44.0% |
45.7% |
47.0% |
49.5% |

|
27.4% |
26.0% |
24.1% |
32.0% |
21.5% |
19.4% |
25.9% |
27.4% |
26.8% |
| Significance
(based on High score group) |
- |
† |
† |
- |
† |
† |
- |
† |
† |
| Note: Significance * p<.05, ** p<.01, *** p<.001 |
|
|
|
|
|
|
|
|
|
|
|
|
|
|
|
|
|
|
|
|
|
|
|
|
|
|
|
|
|
|
|
Survey items and estimation "weights":
† Rate
yourself on each of the following traits as compared with the average person
your age: |
| * Leadership
ability (2.93) |
|
| * Public speaking
ability (2.66) |
|
| * Self-confidence
(social) (2.12) |
|
|
|
|
|
|
|
|
|
|
|
|
|
|
|
|
|
|
|
|
|
|
|
|
|
|
|
|
|
|
|
|
|
|
|
|
|
|
|
|
|


