|
|
2017 College Senior
Survey
CIRP Construct Percentage Report
Negative Cross-Racial Interaction
Graduating Seniors |
|
|
|
|
|
|
|
|
|
|
| Negative Cross-Racial Interaction is a
unified measure of students’ level of negative interaction with diverse
peers. |
|
|
|
|
|
|
|
|
|
|
|
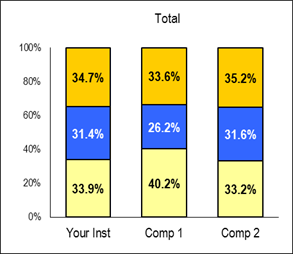
Total |
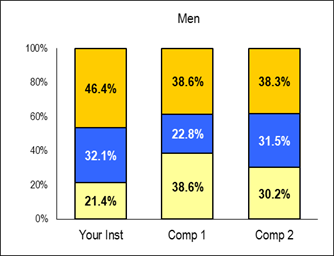
Men |
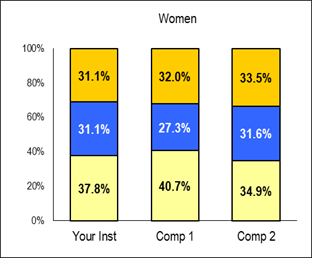
Women |
| Montclair
State University |
Your Inst |
Comp 1 |
Comp 2 |
Your Inst |
Comp 1 |
Comp 2 |
Your Inst |
Comp 1 |
Comp 2 |
| Total
(n) |
118 |
709 |
14,937 |
28 |
171 |
5,445 |
90 |
538 |
9,492 |

| High
Negative Cross-Racial Interaction |
|
34.7% |
33.6% |
35.2% |
46.4% |
38.6% |
38.3% |
31.1% |
32.0% |
33.5% |

| Average
Negative Cross-Racial Interaction |
|
31.4% |
26.2% |
31.6% |
32.1% |
22.8% |
31.5% |
31.1% |
27.3% |
31.6% |

| Low
Negative Cross-Racial Interaction |
|
33.9% |
40.2% |
33.2% |
21.4% |
38.6% |
30.2% |
37.8% |
40.7% |
34.9% |
| Significance
(based on High score group) |
- |
|
|
- |
|
|
- |
|
|
| Note: Significance * p<.05, ** p<.01, *** p<.001 |
|
|
|
|
|
|
|
|
|
|
|
|
|
|
|
|
|
|
|
|
|
|
|
|
|
|
|
|
|
|
|
Survey items and estimation "weights":
To what extent have you experienced the
following with students from a racial/ethnic group other than your own? |
| * Had tense,
somewhat hostile interactions (3.81) |
|
| * Felt insulted or
threatened because of your race/ethnicity (2.63) |
|
| * Had guarded,
cautious interactions (2.10) |
|
|
|
|
|
|
|
|
|
|
|
|
|
|
|
|
|
|
|
|
|
|
|
|
|
|
|
|
|
|
|
|
|
|
|
|
|
|
|
|
|
|
|
|
|
|
|
|
|
|
|
|
|
|
|
|
|
|
|
|
|
|
|
|
|
|
|
|
|
|
|
|
|
|
|
|
|
|
|
|
|